
Global Extreme Weather and Climate Change Dashboard
Library
The primary literature the GWX dashboard's methodology and findings rest on -- the source papers each phenomenon page replicates or extends, the statistical methods behind lib/trend.ts's detection test, and the IPCC assessment report behind the Detection & Attribution page. This list weights toward literature since AR6 (2021 or later, flagged below) -- newer findings that extend, independently confirm, or postdate AR6's own evidence base. Not an exhaustive review of each field; see each phenomenon page's notes and the Methodology page for how each source informs this site. Also see The Honest Broker for Roger Pielke Jr.'s ongoing writing, including his published critique of the AR6 tropical-cyclone finding discussed on the Detection & Attribution page.
Summary Judgment
This site is consistent with the post-AR6 literature:
- Drought — Vicente-Serrano et al. (2022) supplies the atmospheric-evaporative-demand mechanism the Drought page's SPEI-style series measures. Gebrechorkos et al. (2025), cited here until 15 September 2026 as post-AR6 confirmation, now stands retracted by Nature, effective 2 September 2026 (doi:10.1038/s41586-026-11027-z), and the retraction withdraws that support. The post-AR6 paper standing in its place, Xu et al. (2026), cuts against the magnitude of this site's AED-inclusive series: it reports Penman-type evaporative-demand formulations inflating drying trends at least sixfold over energy-constrained ones, which makes the Hargreaves-based series here an upper bound. Its first-order finding of a significant global drying trend agrees with what this site detects; its headline concerns acceleration, which this site does not measure.
- Wildfire — Jones et al. (2022) and Kelley et al. (2025, "State of Wildfires 2024–2025") both confirm the same pattern the Wildfire page's GWIS series shows: burned area declining even as individual fires grow more extreme.
- Flooding — Gudmundsson et al. (2021) finds the same spatially incoherent, no-single-global-direction river-flow pattern as the Flooding page's GloFAS series.
- Tropical cyclones — Bhatia et al. (2022) and Balaguru et al. (2024) supply physical mechanisms consistent with the rapid-intensification increase this site tracks.
No post-AR6 source in this Library contradicts a detected trend already reported elsewhere on this site. See each citation's note above for the specific comparison, and the Detection & Attribution page for this site's parallel comparison against AR6 itself.
Tropical Cyclones
- Kossin, J.P., Knapp, K.R., Olander, T.L., Velden, C.S. (2020). Global increase in major tropical cyclone exceedance probability over the past four decades. Proceedings of the National Academy of Sciences, 117(22), 11975–11980. The finding behind AR6 SPM statement A.3.4. See the Detection & Attribution page for a documented critique of how it reached AR6, and the Kossin et al. correction entry.
- Kossin, J.P., Knapp, K.R., Olander, T.L., Velden, C.S. (2020). Correction for Kossin et al., Global increase in major tropical cyclone exceedance probability over the past four decades. Proceedings of the National Academy of Sciences, 117(45), 28532. Published before AR6's citation deadline; narrows the statistically significant result from global to two basins.
- Klotzbach, P.J., Landsea, C.W. (2015). Extremely intense hurricanes: Revisiting Webster et al. (2005) after 10 years. Journal of Climate, 28(19), 7621–7629. Basis for the 1980 reliable-trend-window start used here (pre-1980s satellite intensity estimates predate the standardized Dvorak technique).
- Post-AR6Klotzbach, P.J., Bell, M.M., Bowen, S.G., Gibney, E.J., Knapp, K.R., Schreck III, C.J. (2022). Trends in global tropical cyclone activity: 1990–2021. Geophysical Research Letters, 49, e2021GL095774.
- Post-AR6Bhatia, K.T., Vecchi, G.A., Knutson, T.R., Murakami, H., Kossin, J., Dixon, K.W., Whitlock, C.E. (2022). A potential explanation for the global increase in tropical cyclone rapid intensification. Nature Communications, 13, 6626. Post-AR6. A candidate physical mechanism (a warming ocean, more favorable environments) for the global rapid-intensification-rate increase the Detection & Attribution page discusses via the Kossin et al. 2020 finding.
- Maue, R.E. (2011). Recent historically low global tropical cyclone activity. Geophysical Research Letters, 38, L14803.
- Weinkle, J., Maue, R., Pielke Jr., R. (2012). Historical global tropical cyclone landfalls. Journal of Climate, 25(13), 4729–4735. Supplies the landfall definition the Global Landfalls variable applies -- the storm center crossing a coastline, detected from fix positions rather than from a source's landfall flag. Ryan Maue's independent compilation at climatlas.com applies the same method and replicates that variable's findings; see the Methodology page.
- Post-AR6Balaguru, K., Chang, C.-C., Leung, L.R., Foltz, G.R., Hagos, S.M., Wehner, M.F., Kossin, J.P., Ting, M., Xu, W. (2024). A global increase in nearshore tropical cyclone intensification. Earth's Future, 12(5), e2023EF004230. Post-AR6. Rapid intensification events within 400 km of a coastline tripled globally from 1980 to 2020 -- a coastal-landfall-focused complement to Bhatia et al. (2022)'s basin-wide mechanism finding.
- Knutson, T., Camargo, S.J., Chan, J.C.L., Emanuel, K., Ho, C.-H., Kossin, J., Mohapatra, M., Satoh, M., Sugi, M., Walsh, K., Wu, L. (2019). Tropical cyclones and climate change assessment: Part I. Detection and attribution. Bulletin of the American Meteorological Society, 100(10), 1987–2007. The World Meteorological Organization expert-team consensus assessment of which global and basin-scale tropical cyclone trends are detectable in the observational record, the multi-decade synthesis alongside the detection standard here.
Heat & Cold Extremes
- Zhang, X., Hegerl, G., Zwiers, F.W., Kenyon, J. (2005). Avoiding inhomogeneity in percentile-based indices of temperature extremes. Journal of Climate, 18(11), 1641–1651. The ETCCDI/CLIMDEX standard definitions (fixed 1961-1990 base period, bootstrap-corrected percentile thresholds) the Heat Waves (TXx/WSDI/TN90p) and Cold Extremes (TNn/CSDI/TN10p) pages both implement directly rather than a project-specific choice.
- Zhang, X., Alexander, L., Hegerl, G.C., Jones, P., Klein Tank, A., Peterson, T.C., Trewin, B., Zwiers, F.W. (2011). Indices for monitoring changes in extremes based on daily temperature and precipitation data. WIREs Climate Change, 2(6), 851–870. The source of the TXx/WSDI/TN90p/TNn/CSDI/TN10p/FD indices here: a broader ETCCDI index-set review.
- Seneviratne, S.I., Zhang, X., Adnan, M., Badi, W., Dereczynski, C., Di Luca, A., Ghosh, S., Iskandar, I., Kossin, J., Lewis, S., Otto, F., Pinto, I., Satoh, M., Vicente-Serrano, S.M., Wehner, M., Zhou, B. (2021). Weather and climate extreme events in a changing climate. In: Climate Change 2021: The Physical Science Basis (IPCC AR6 WGI, Chapter 11), Cambridge University Press. AR6's chapter-length assessment of temperature and precipitation extremes globally, covering both the Heat Waves and Cold Extremes pages.
- Post-AR6McKinnon, K.A., Simpson, I.R., Williams, A.P. (2024). The pace of change of summertime temperature extremes. Proceedings of the National Academy of Sciences, 121(42), e2406143121. Post-AR6. Ninety years of station data (1959–2023): the hottest summer days have warmed at essentially the same rate as the seasonal median, with the observed widening of the warm tail driven by the cold tail warming more slowly, not by acceleration in the hot tail.
Drought
- Post-AR6Vicente-Serrano, S.M., Peña-Angulo, D., Beguería, S., Domínguez-Castro, F., Tomás-Burguera, M., Noguera, I., Gimeno-Sotelo, L., El Kenawy, A. (2022). Global drought trends and future projections. Philosophical Transactions of the Royal Society A, 380, 20210285. The paper that motivated the Drought page's AED-inclusive series, and two of its choices match the ones here: a three-month timescale, and AED from ERA5. It uses the full FAO-56 Penman-Monteith equation where this site uses Hargreaves. The results now DIVERGE, and the Drought section of the Methodology page says so: the paper reports no substantial global change in meteorological drought over at least 120 years and a statistically significant DECLINE in 12-month-SPI drought area over 1950-2020 in both CRU and GPCC, with its AED-inclusive drying signal regional rather than global. This site's precipitation-only series shows a detected global increase, the opposite sign, and its AED-inclusive series detects globally. The two agreed until 15 September 2026, when correcting an unweighted grid-cell average lifted the precipitation-only series above the detection bar. Gauge-based precipitation against ERA5 reanalysis, 12 months against three, and 1950-2020 against 1979-2026 all bear on the comparison, which this site states and leaves open.
- Allen, R.G., Pereira, L.S., Raes, D., Smith, M. (1998). Crop evapotranspiration: Guidelines for computing crop water requirements. FAO Irrigation and Drainage Paper No. 56, Food and Agriculture Organization of the United Nations, Rome. Source of the Hargreaves-Samani method this site uses to estimate atmospheric evaporative demand from ERA5 temperature; verified against the paper's worked example (Example 8) to within 0.1%.
- Post-AR6Xu, J., Zhang, X., McColl, K.A., Berg, A., Zhou, S., Yang, J., Dong, Z., Luo, Y., Fan, Y. (2026). Global drought shows no detectable recent acceleration under climate warming. Communications Earth & Environment, 7, 726. Post-AR6, and it cuts against the magnitude of this site's AED-inclusive series rather than supporting it, and so earns a place here. Applying six potential-evapotranspiration formulations to SPEI over 1981-2024, the authors report that Penman-type PET produces drying trends at least six times stronger than energy-constrained formulations (drought-area trends 7.8x), because Penman-type estimates neglect the land-atmosphere coupling that limits evaporative demand. The share of the drought trend attributable to PET falls from 47.5% to 25% once that constraint applies, leaving precipitation as the dominant driver at 75%. Their first-order finding still shows a statistically significant global drying trend under both PET families; they find no evidence for ACCELERATION, a second-order trend this site does not measure or claim. The Hargreaves method this site uses sits among the unconstrained estimators rather than the energy-based ones, so the Methodology page's caveat quotes this paper's figures. Their target is Gebrechorkos et al. 2025 below, which Nature retracted nine days before this paper's publication.
- Milly, P.C.D., Dunne, K.A. (2016). Potential evapotranspiration and continental drying. Nature Climate Change, 6, 946-949. The energy-only potential-evapotranspiration formulation (PET = 0.8 x net radiation / latent heat of vaporisation) that Xu et al. 2026 above adopt as their principal alternative to Penman-type estimates. The pipeline here computes it alongside Penman-Monteith from the same ARCO-ERA5 radiation fetch, since it requires only net radiation.
- Post-AR6Gebrechorkos, S.H., Sheffield, J., Vicente-Serrano, S.M., Funk, C., Miralles, D.G., Peng, J., Dyer, E., Talib, J., Beck, H.E., Singer, M.B., Dadson, S.J. (2025). Warming accelerates global drought severity [RETRACTED]. Nature, 642, 628–635 — RETRACTED 2 September 2026. RETRACTED by Nature on 2 September 2026 (doi:10.1038/s41586-026-11027-z). The retraction notice lists four problems: study-wide averages taken without area weighting of grid cells, GLEAM v3 results presented as GLEAM4, a date-parsing error that misassigned months where the authors split 1981-2017 from 2018-2022, and an arid-region mask (mean annual precipitation under 180mm) applied to one figure and omitted from the drought-area percentages. The paper had reported a ~40% AED-driven increase in global drought severity, and this Library cited it until 15 September 2026 as post-AR6 confirmation of the mechanism behind the SPEI-style series. A retracted paper supports nothing: the entry stays for the record, and that mechanism now rests on the Vicente-Serrano et al. 2022 entry. Two of the four problems, area weighting and the arid mask, prompted a full audit of this site's drought index (see the Drought section of the Methodology page).
- Balsamo, G., Beljaars, A., Scipal, K., Viterbo, P., van den Hurk, B., Hirschi, M., Betts, A.K. (2009). A Revised Hydrology for the ECMWF Model: Verification from Field Site to Terrestrial Water Storage and Impact in the Integrated Forecast System. Journal of Hydrometeorology, 10(3), 623–643. Describes HTESSEL, the ECMWF land-surface scheme whose four soil layers ERA5 reports. The agricultural-drought series here depth-weights layers 1-3 by their real thicknesses (7, 21 and 72cm) into a 0-100cm root-zone value rather than averaging them equally, and reports layer 1 alone as the 0-7cm surface series; this paper supplies the source for those depths.
Wildfire
- Andela, N., Morton, D.C., Giglio, L., Chen, Y., van der Werf, G.R., Kasibhatla, P.S., DeFries, R.S., Collatz, G.J., Hantson, S., Kloster, S., Bachelet, D., Forrest, M., Lasslop, G., Li, F., Mangeon, S., Melton, J.R., Yue, C., Randerson, J.T. (2017). A human-driven decline in global burned area. Science, 356(6345), 1356–1362. The Wildfire page's GWIS/land-cover series confirms this paper's finding directly: global burned area has declined roughly 18% from 2002–2012 to 2013–2024.
- Post-AR6Chen, Y., Hall, J., van Wees, D., Andela, N., Hantson, S., Giglio, L., van der Werf, G.R., Morton, D.C., Randerson, J.T. (2023). Multi-decadal trends and variability in burned area from the fifth version of the Global Fire Emissions Database (GFED5). Earth System Science Data, 15, 5227–5259.
- Post-AR6Jones, M.W., Abatzoglou, J.T., Veraverbeke, S., Andela, N., Lasslop, G., Forkel, M., Smith, A.J.P., Burton, C., Betts, R.A., van der Werf, G.R., Sitch, S., Canadell, J.G., Santín, C., Kolden, C., Doerr, S.H., Le Quéré, C. (2022). Global and regional trends and drivers of fire under climate change. Reviews of Geophysics, 60(3), e2020RG000726. Post-AR6. A synthesis of 500+ studies and satellite/model reanalysis: burned area declines globally even as fire weather severity and human exposure both rise, the same divergence the Wildfire page tracks via the GWIS/land-cover series.
- Post-AR6Kelley, D.I., Burton, C., Di Giuseppe, F., Jones, M.W., Barbosa, M.L.F., et al. (2025). State of Wildfires 2024–2025. Earth System Science Data, 17(10), 5377–5488. Post-AR6. The most recent edition of this annual assessment: global burned area stayed below average through the March 2024-February 2025 fire season even as individual events (Los Angeles, January 2025; Canada's boreal forests; South American rainforest and wetland fires) grew more extreme and costly -- the exact declining-area-vs-costlier-extremes divergence Jones et al. (2022) above first documented, now current through the most recent fire season.
Tornadoes & Severe Convective Storms
- Brooks, H.E., Doswell III, C.A. (2001). Some aspects of the international climatology of tornadoes by damage classification. Atmospheric Research, 56(1-4), 191–201. Source of the ~75%-of-world's-known-tornadoes-in-the-US figure the Tornadoes page cites as the basis for using US counts as a global severe-convective-storm indicator.
- Post-AR6Taszarek, M., Allen, J.T., Marchio, M., Brooks, H.E. (2021). Global climatology and trends in convective environments from ERA5 and rawinsonde data. npj Climate and Atmospheric Science, 4, 35. Source of the global CAPE climatology and trend methodology the Tornadoes page's CAPE series (ARCO-ERA5) rests on -- finds mixed-direction regional CAPE/shear trends, consistent with this site's mixed-direction detected changes across its three CAPE-derived series.
Extratropical Cyclones
- Post-AR6Gray, S.L., Volonté, A., Martínez-Alvarado, O., Harvey, B.J. (2024). A global climatology of sting-jet extratropical cyclones. Weather and Climate Dynamics, 5, 1523–1544. Source of the TRACK-catalog extratropical cyclone intensity series used here.
- Sanders, F., Gyakum, J.R. (1980). Synoptic-dynamic climatology of the "bomb". Monthly Weather Review, 108(10), 1589–1606. The original "bomb cyclone" (explosive cyclogenesis) definition -- the latitude-adjusted Bergeron threshold the bomb-cyclone classification here (n_bomb_cyclones, and now the Cold Extremes/CSDI page's methodology) rests on directly.
- Post-AR6Keates, O., et al. (2024). Storm Ciarán — synoptic evolution and warning strategy of the intense mid-latitude windstorm affecting parts of Northwest Europe on 1/2 November 2023. Weather, 79(4). Post-AR6. A recent, extreme European windstorm (one of the most intense North Atlantic extratropical cyclones on record) -- a natural future validation check for the Europe-continent ETC intensity series here, the same role the already-validated Braer Storm (1993) plays for the global series.
Flooding
- Post-AR6Gudmundsson, L., Boulange, J., Do, H.X., Gosling, S.N., Grillakis, M.G., Koutroulis, A.G., Leonard, M., Liu, J., Müller Schmied, H., Papadimitriou, L., Pokhrel, Y., Seneviratne, S.I., Satoh, Y., Thiery, W., Westra, S., Zhang, X., Zhao, F. (2021). Globally observed trends in mean and extreme river flow attributed to climate change. Science, 371(6534), 1159–1162. A global streamflow-trend detection study feeding directly into AR6 Ch.11's river-flood assessment: observed trends are real but not spatially coherent in one direction, the same patchy, no-single-global-signal pattern as this site's GloFAS-based continent series.
- Harrigan, S., Zsoter, E., Alfieri, L., Prudhomme, C., Salamon, P., Wetterhall, F., Barnard, C., Cloke, H., Pappenberger, F. (2020). GloFAS-ERA5 operational global river discharge reanalysis 1979–present. Earth System Science Data, 12, 2043–2060. Primary source for the Flooding page (both the percentile-based and GloFAS-return-period-based series). The paper's documented 1-year model spin-up procedure leaves a residual bias in slow-draining basins through 1981, the basis for the flooding reliable-trend-window start year used here.
- Wasko, C., Sharma, A. (2017). Global assessment of flood and storm extremes with increased temperatures. Scientific Reports, 7, 7945.
- Wasko, C., Nathan, R. (2019). Influence of changes in rainfall and soil moisture on trends in flooding. Journal of Hydrology, 575, 432–441.
- Post-AR6Ho, M., Nathan, R., Wasko, C., Vogel, E., Sharma, A. (2022). Projecting changes in flood event runoff coefficients under climate change. Journal of Hydrology, 615, 128689. Basis for the Flooding page's north/south-Australia divergence note.
- Post-AR6Tramblay, Y., Villarini, G., El Khalki, M.E., Gründemann, G., Hughes, D. (2021). Evaluation of the drivers responsible for flooding in Africa. Water Resources Research, 57(6), e2021WR029595. Basis for the Africa continent-page flooding note: 399 African gauges, 1981-2018, found flood magnitude more strongly driven by soil moisture than by rainfall extremes.
- Blöschl, G., Hall, J., Viglione, A., Perdigão, R.A.P., Parajka, J., Merz, B., et al. (2019). Changing climate both increases and decreases European river floods. Nature, 573, 108–111. Basis for the Europe continent-page flooding note: opposite-signed regional flood trends (increasing NW Europe, decreasing S/E Europe) rather than a single continent-wide direction.
- Hodgkins, G.A., Whitfield, P.H., Burn, D.H., Hannaford, J., Renard, B., Stahl, K., Fleig, A.K., Madsen, H., Mediero, L., Korhonen, J., Murphy, C., Wilson, D. (2017). Climate-driven variability in the occurrence of major floods across North America and Europe. Journal of Hydrology, 552, 704–717. Basis for the North America continent-page flooding note: no widespread significant trend in major-flood occurrence (1961-2010), dominated by multidecadal variability rather than a directional trend.
- Barichivich, J., Gloor, E., Peylin, P., Brienen, R.J.W., Schöngart, J., Espinoza, J.C., Pattnayak, K.C. (2018). Recent intensification of Amazon flooding extremes driven by strengthened Walker circulation. Science Advances, 4(9), eaat8785. Basis for the South America continent-page flooding note: a fivefold increase in severe Amazon floods at Manaus since the early 2000s.
- Do, H.X., Westra, S., Leonard, M. (2017). A global-scale investigation of trends in annual maximum streamflow. Journal of Hydrology, 552, 28–43. Basis for the Asia continent-page flooding note: Asia's average streamflow gauge record length (~17 years) falls short of a defensible long-term trend claim -- a data-coverage gap rather than an absence of interest.
Loss Normalization
- Pielke Jr., R. (2020). Economic 'normalisation' of disaster losses 1998–2020: a literature review and assessment. Environmental Hazards. Source of the full Table 1 (53 weather/climate-related normalization studies) on the Loss Normalization page.
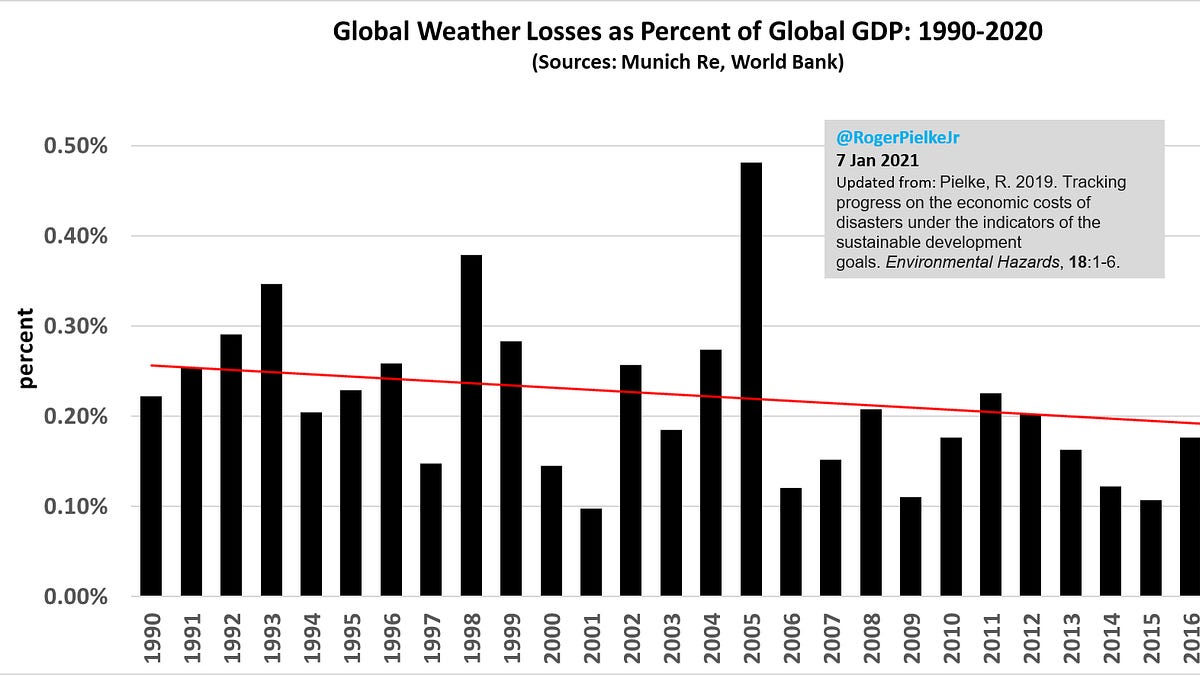
- Pielke Jr., R. (2019). Tracking progress on the economic costs of disasters under the indicators of the sustainable development goals. Environmental Hazards, 18(1), 1–6. Finds weather/climate disaster losses declined as a share of global GDP from 1990, even as absolute losses rose -- the indicator the Loss Normalization page's top chart extends through 2025.
- Mohleji, S., Pielke Jr., R. (2014). Reconciliation of trends in global and regional economic losses from weather events: 1980–2008. Natural Hazards Review, 15(4), 04014009. Source of the Loss Normalization page's economic-loss-by-phenomenon-and-continent pie charts (extended through 2025 with fresher EM-DAT data, replacing the paper's rate-of-increase framing).
- Post-AR6Centre for Research on the Epidemiology of Disasters (CRED), UCLouvain (2026). EM-DAT: The International Disaster Database. emdat.be. Source (via Our World in Data's public mirror) of the Loss Normalization page's economic-loss and fatality data, and the Flooding/Wildfire economic-context figures on this dashboard.
- Post-AR6Zhang, J., Trück, S., Truong, C., Pitt, D. (2023). Time trends in losses from major tornadoes in the United States. Weather and Climate Extremes, 41, 100579. Added to the Loss Normalization page's study table: a significant national decline in normalized US tornado losses, 1954-2018.
- Post-AR6Willoughby, H.E., Hernandez, J.I., Pinnock, A. (2024). Trends in U.S. Atlantic tropical cyclone damage, 1900–2022. Journal of Applied Meteorology and Climatology, 63(12), 1499–1510. Uses the ICAT Damage Estimator dataset (flagged in the study table's ICAT/BDD column); reports a detected increase in normalized US Atlantic hurricane damage. See Pielke (2025) below and this same author team's 2025 reply.
- Post-AR6Muller, J., Mooney, K., Bowen, S.G., Klotzbach, P.J., Martin, T., Philp, T.J., Bhatt, D., Dixon, R.S., Girimurugan, S.B. (2025). Normalized hurricane damage in the United States: 1900–2022. Bulletin of the American Meteorological Society, 106(1), E51–E67. Also uses the ICAT/combined dataset; finds no detected trend in normalized US hurricane damage over the full record.
- Post-AR6Pielke Jr., R. (2025). Do not use the ICAT hurricane loss "dataset": An opportunity for course correction in climate science. Journal of Applied Meteorology and Climatology, 64(4). A direct critique of the ICAT Damage Estimator dataset's reliability as a basis for trend detection, aimed at Willoughby et al. (2024) and Muller et al. (2025) above -- see Willoughby et al.'s (2025) direct reply.
- Post-AR6Willoughby, H.E., Hernandez, J.I., Pinnock, A. (2025). Reply to Pielke (2025). Journal of Applied Meteorology and Climatology, 64(4). Direct reply to the critique above; revises the authors' 2024 trend finding down to a weaker, not-statistically-significant 0.6%/year result.
- Post-AR6Paprotny, D., Tilloy, A., Treu, S., Buch, A., Vousdoukas, M.I., Feyen, L., Kreibich, H., Merz, B., Frieler, K., Mengel, M. (2025). Attribution of flood impacts shows strong benefits of adaptation in Europe since 1950. Science Advances, 11, eadt7068. Added to the study table: a detected decrease in normalized European flood losses, attributed to adaptation.
- Post-AR6Paprotny, D., Terefenko, P., Śledziowski, J. (2024). HANZE v2.1: An improved database of flood impacts in Europe from 1870 to 2020. Earth System Science Data, 16, 5145–5170. The underlying European flood-impact database Paprotny et al. (2025) above draws on; this paper finds reporting completeness rather than a trend dominates the raw 1870-2020 record's apparent pattern.
- Post-AR6Vessey, A.F., Baker, A.J., Marcellin-Honore, V., Michelin, J. (2026). Combining hazard, exposure and vulnerability data to predict historical United States hurricane losses. Natural Hazards and Earth System Sciences, 26, 2133–2150. Primarily a loss-prediction methodology paper; an upward fit in US hurricane losses (1979-2024) appears incidentally rather than as a tested detection claim.
- Post-AR6Botzen, W.J.W., Estrada, F., Tol, R.S.J. (2021). Methodological issues in natural disaster loss normalisation studies. Environmental Hazards, 20(2), 112–115. A methods-focused commentary on normalization studies generally, added to the study table as a methods row (no empirical detection/attribution result).
Statistical Methodology
- Mann, H.B. (1945). Nonparametric tests against trend. Econometrica, 13(3), 245–259. The Mann-Kendall trend test itself -- the significance test lib/trend.ts applies to every variable on this site.
- Sen, P.K. (1968). Estimates of the regression coefficient based on Kendall's tau. Journal of the American Statistical Association, 63(324), 1379–1389. Sen's slope estimator -- the trend-magnitude (per-decade rate) figure shown on every chart's assessment text.
- Weatherhead, E.C., Reinsel, G.C., Tiao, G.C., Meng, X.-L., Choi, D., Cheang, W.-K., Keller, T., DeLuisi, J., Wuebbles, D.J., Kerr, J.B., Miller, A.J., Oltmans, S.J., Frederick, J.E. (1998). Factors affecting the detection of trends: Statistical considerations and applications to environmental data. Journal of Geophysical Research, 103(D14), 17149–17161. The standard formula for how many years of record a trend of a given magnitude and noise level needs for reliable detection. lib/trend.ts computes it for every variable on every build. This site does NOT publish the result, and the Detection and Time of Emergence page says why: fed the slope estimated from the record under test, it becomes post-hoc power (Hoenig & Heisey below), which explains away nothing about that same record's null result. Fed a projected signal assessed independently of the record, the same formula gives an emergence timescale in the sense of Crompton et al. below.
- Hamed, K.H., Rao, A.R. (1998). A modified Mann-Kendall trend test for autocorrelated data. Journal of Hydrology, 204(1-4), 182–196. Basis for the lag-1-autocorrelation effective-sample-size correction in lib/trend.ts -- a simplification of this paper's full multi-lag method, a GWX-specific enhancement not yet on the US dashboard.
- Benjamini, Y., Hochberg, Y. (1995). Controlling the false discovery rate: A practical and powerful approach to multiple testing. Journal of the Royal Statistical Society, Series B, 57(1), 289–300. The false-discovery-rate correction lib/bhCorrection.ts applies across the headline variables tracked here -- see the Methodology page's multiple-comparisons section.
- Cohen, J. (1988). Statistical Power Analysis for the Behavioral Sciences. 2nd edition, Routledge. Reference point (Cohen's d ≈ 0.2/0.5/0.8 for small/medium/large effect) informing the magnitude-vs-natural-variability detection tier used here.
- Hoenig, J.M., Heisey, D.M. (2001). The abuse of power: The pervasive fallacy of power calculations for data analysis. The American Statistician, 55(1), 19–24. Why this site declines to publish a years-to-detection figure computed from the observed slope. Power calculated after the fact from an effect size the same data produced adds nothing beyond the p-value already reported, and reliably understates how long detection would take for any result that happened to come out null.
- Hawkins, E., Sutton, R. (2012). Time of emergence of climate signals. Geophysical Research Letters, 39(1), L01702. The signal-to-noise formulation of time of emergence, and the convention AR6 WG1 Chapter 12 adopts by default -- a signal-to-noise ratio above 1 against a pre-industrial baseline and interannual variability. Chapter 12 states that it assesses across multiple methods and adopts this one only where a study does not specify otherwise.
- Chadwick, C., Gironás, J., Vicuña, S., Meza, F. (2019). Estimating the local time of emergence of climatic variables using an unbiased mapping of GCMs: An application in semiarid and Mediterranean Chile. Journal of Hydrometeorology, 20(8), 1635–1647. The second definition of emergence named in AR6 WG1 Chapter 12's opening sentence on the subject: a signal emerges when an indicator's probability distribution becomes significantly different from its distribution over a reference period, rather than when a ratio crosses a threshold.
- Crompton, R.P., Pielke Jr, R.A., McAneney, K.J. (2011). Emergence timescales for detection of anthropogenic climate change in US tropical cyclone loss data. Environmental Research Letters, 6(1), 014003. A third family of emergence method, and the design the Detection and Time of Emergence page describes: take the projected signal from a source independent of the record, take the noise from the record, and solve for the number of years. Applied to normalized US tropical cyclone losses the answer ran 120 to 550 years across models, and 260 years for the 18-model ensemble.
IPCC Assessment Reports
- IPCC (2021). Climate Change 2021: The Physical Science Basis. Contribution of Working Group I to the Sixth Assessment Report of the Intergovernmental Panel on Climate Change. Cambridge University Press. The Sixth Assessment Report itself -- the comparison point for the Detection & Attribution page.
The Honest Broker: Further Reading
Commentary and analysis from Roger Pielke Jr.'s The Honest Broker on extreme weather, detection, attribution, and disaster losses — a distinct category from the peer-reviewed literature above, collected here for readers who want the fuller discussion behind the GWX dashboard's framing.
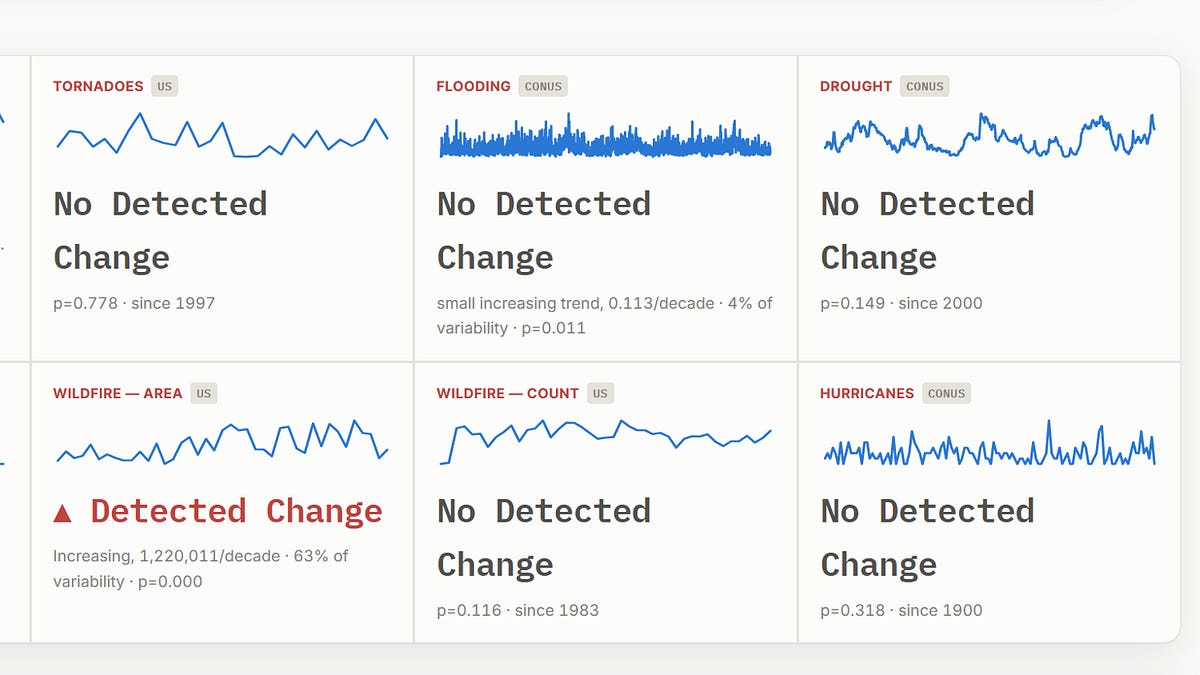
🚨US Extreme Weather and Climate Change Dashboard
Introduces the sibling US Extreme Weather and Climate Change Dashboard and its detection-and-attribution framework.
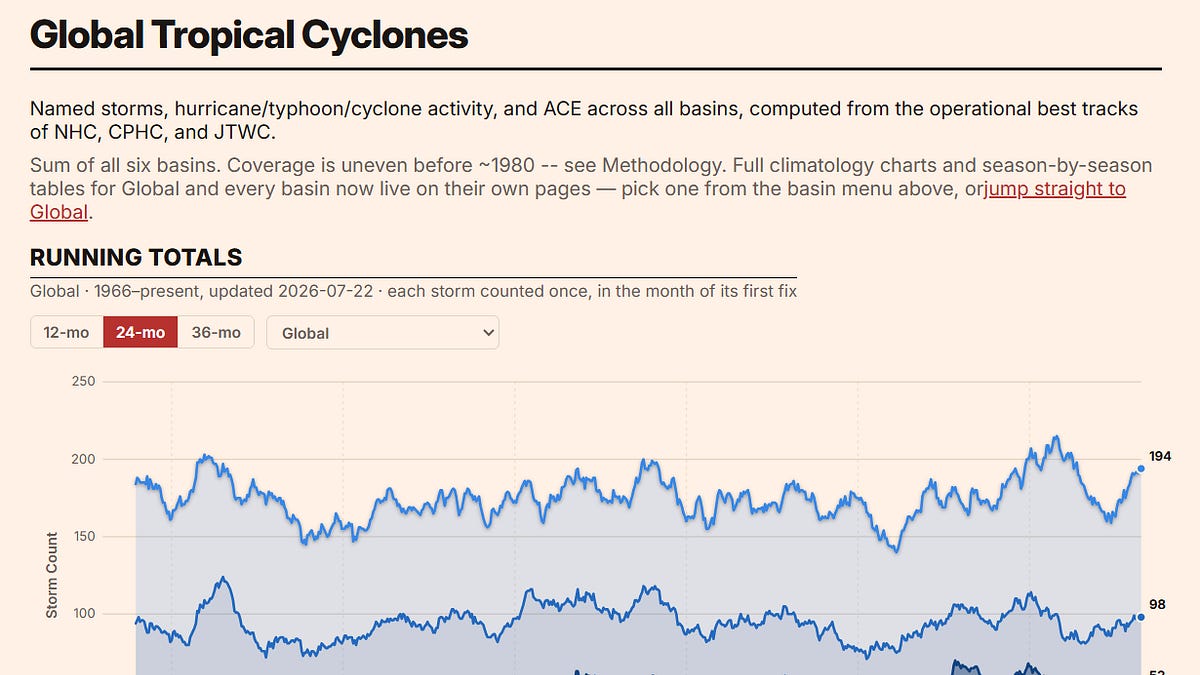
Introducing: Global-Tropical-Cyclones.com
Introduces the companion global-tropical-cyclones.com dashboard tracking worldwide tropical cyclone activity.

Europe's Weather Losses Keep Climbing
Examines normalized weather and climate disaster losses in Europe, 1990-2024.
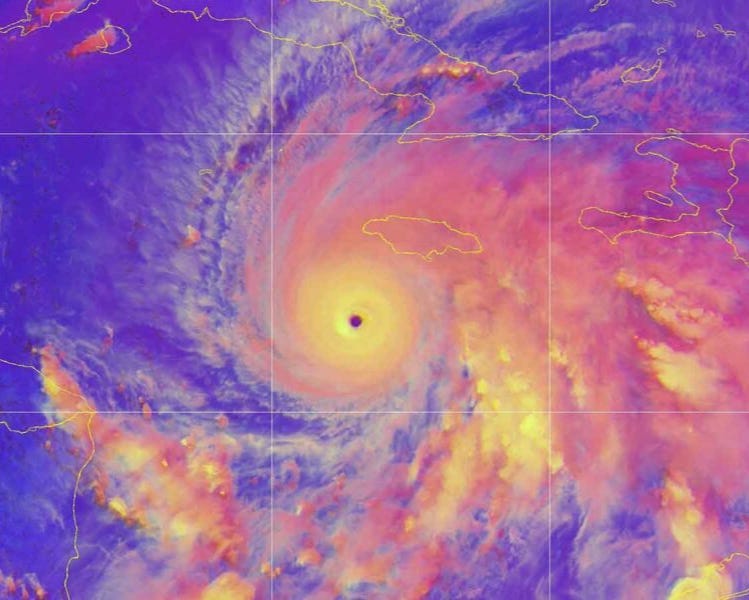
Global Tropical Cyclone Landfalls
Examines global tropical cyclone landfall counts and trends by ocean basin.

The Climate Conversation is Changing
Reviews shifts in public and scientific discussion of extreme weather and climate change.
Extreme Non-Event Attribution
Examines attribution claims made about weather events that did not occur or did not reach extreme thresholds.

Bunk from the Brink
Reviews the evidentiary basis behind a specific extreme-event attribution claim.

Precipitation Paradox?
Examines observed precipitation and flooding trends against climate model expectations.

Is Single Extreme Event Attribution Even Possible?
Weather Attribution Alchemy, Part 5. Distinguishes single-event attribution from the IPCC's detection-and-attribution framework for long-term trends.
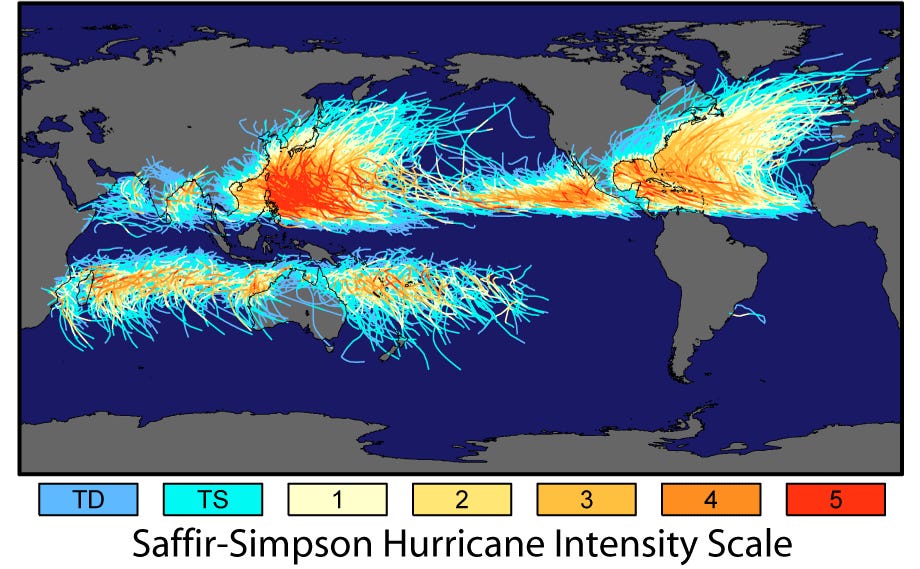
The Most Major Hurricanes Ever
Reviews the historical record of major hurricanes by ocean basin and season.

Attribution Stealth Advocacy at the NAS
Weather Attribution Alchemy, Part 2. Reviews a National Academy of Sciences committee evaluating extreme-event attribution methods, and its funding and membership ties to attribution-advocacy organizations.
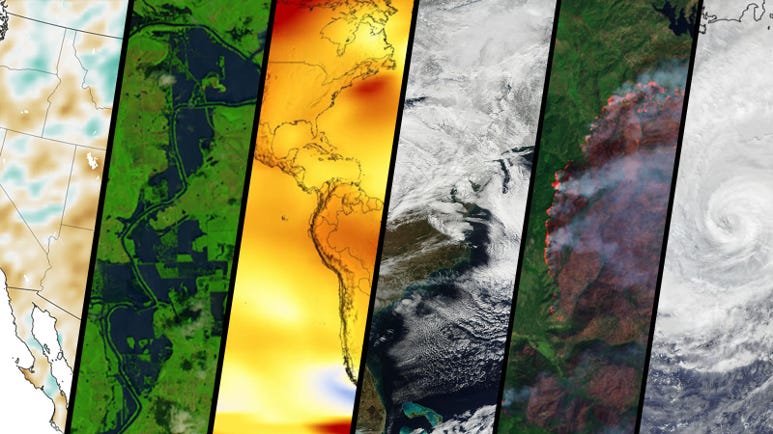
Weather Attribution Alchemy
Part 1 of a series comparing extreme-event attribution studies' claims against the IPCC's own detection-and-attribution findings.
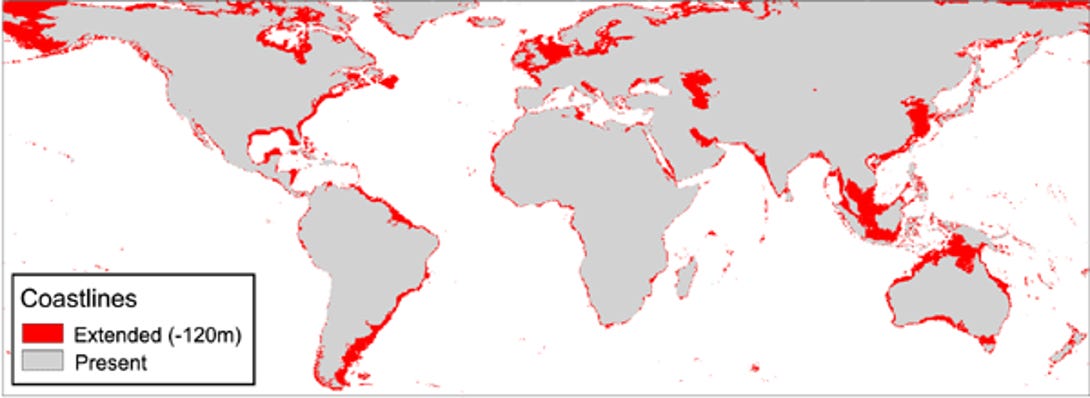
What Did You Expect?
Climate Fueled Extreme Weather, Part 6. Compares observed extreme-weather trends against climate-model projections.

It's All About the Base(line)
Climate Fueled Extreme Weather, Part 5. Examines how the choice of historical baseline period affects reported extreme-weather trends.

We Don't Need No Stinking Science
Climate Fueled Extreme Weather, Part 4. Reviews the evidentiary standards used in extreme-weather-attribution claims.

It's Later Than You Think
Climate Fueled Extreme Weather, Part 3. Compares current extreme-event trends against historical baselines.

Schrödinger's Climate Cat
Climate Fueled Extreme Weather, Part 2. Distinguishes detection of a change in extreme-event statistics from attribution of a single event to human-caused climate change.

Climate Fueled Extreme Weather
Opens a multi-part series examining the evidence behind claims that climate change has fueled specific extreme-weather trends.
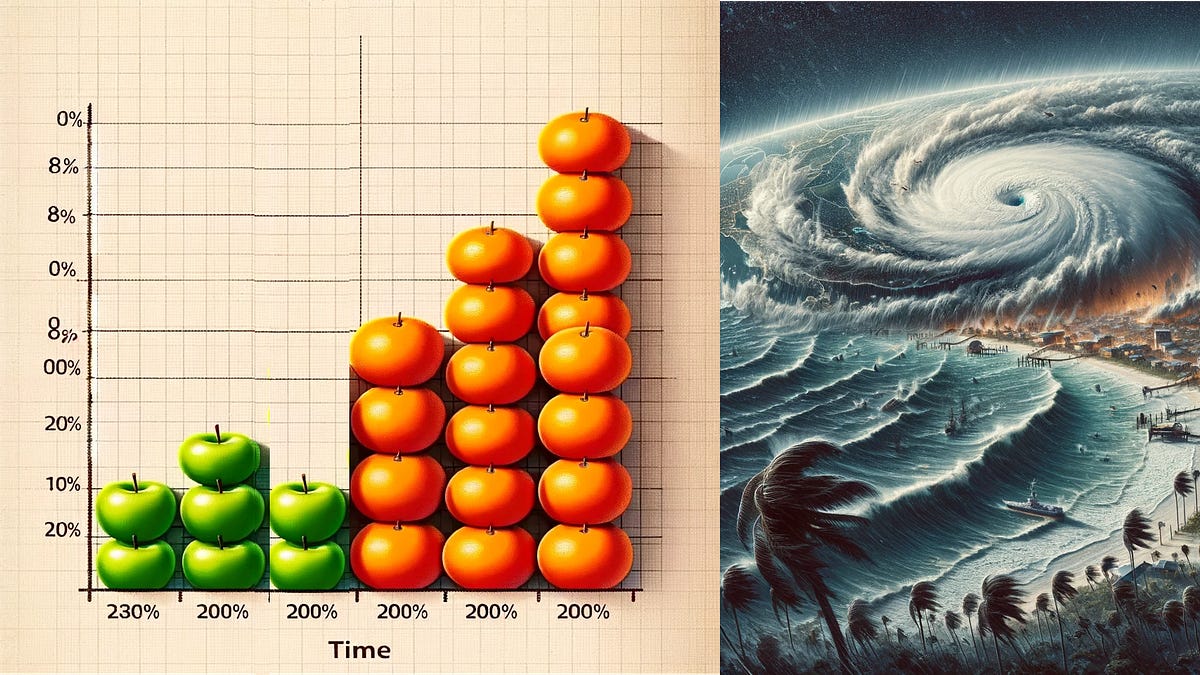
Apples, Oranges, and Normalized Hurricane Damage
Compares different normalized hurricane damage datasets and their divergent trend conclusions.

Global Tropical Cyclones
Reviews global tropical cyclone activity trends using long-term best-track data.
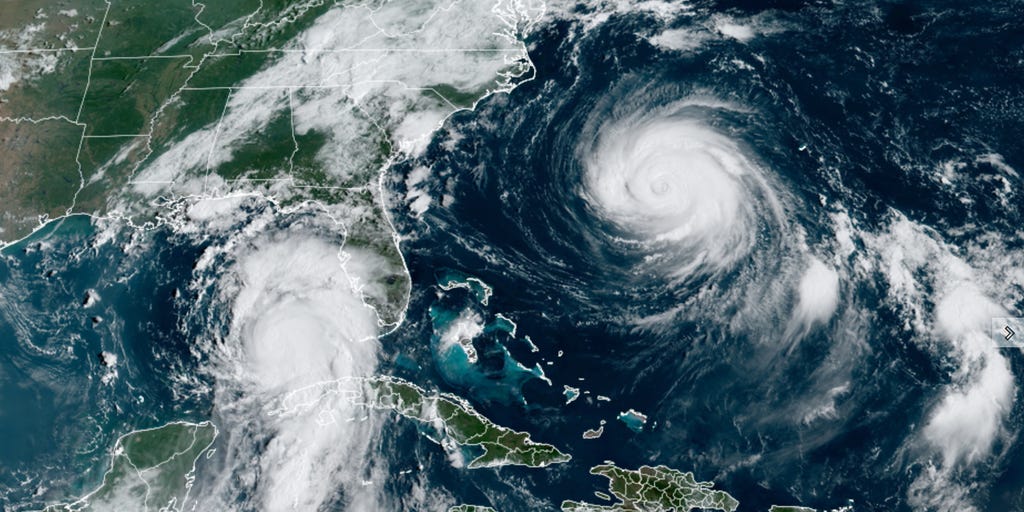
U.S. Hurricane Overview 2023
Reviews the 2023 US hurricane season's landfalls and losses against the historical record.
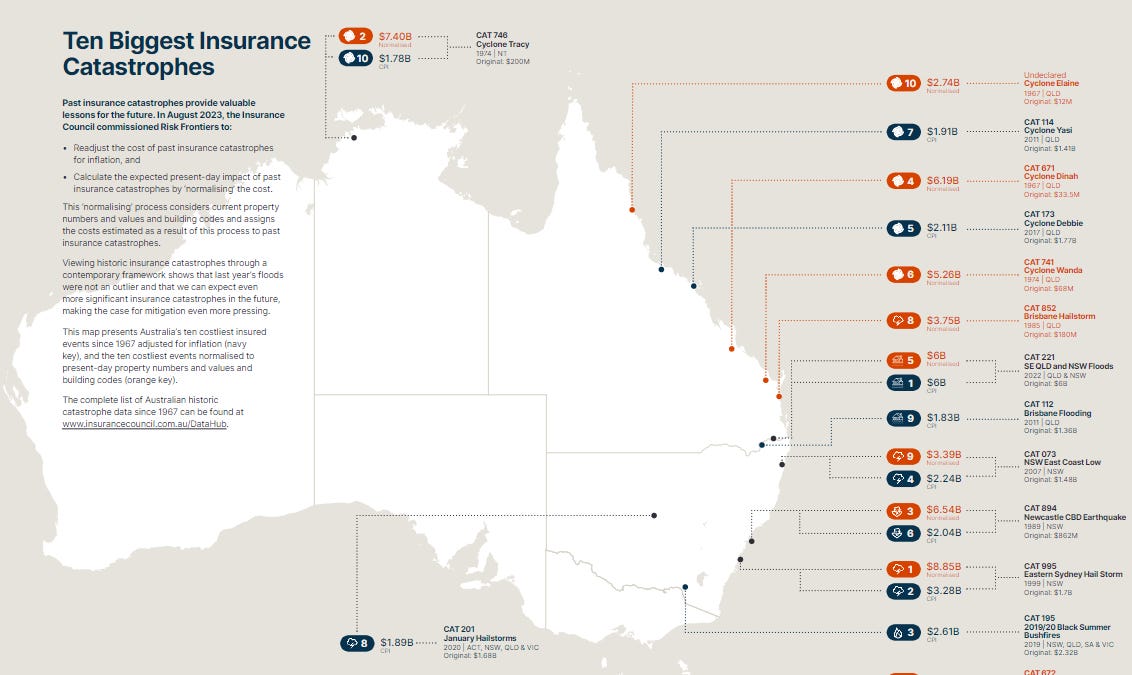
Normalized Disaster Losses in Australia
Reviews normalized weather disaster losses in Australia over the twentieth and twenty-first centuries.
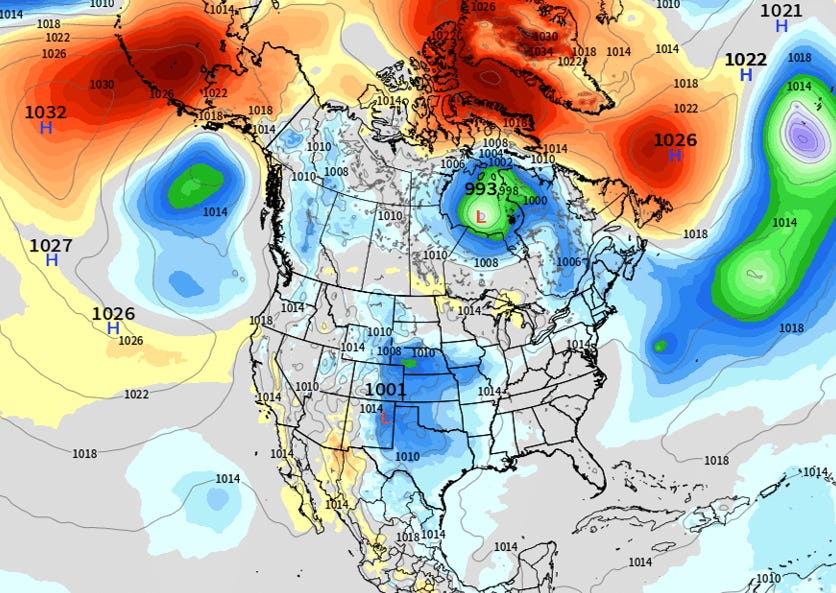
What the IPCC Actually Says About Extreme Weather
Summarizes the IPCC AR6's confidence levels for detected changes in flooding, drought, tropical cyclones, and other extreme-weather types.

Climate Change and Disaster Losses
Reviews the disaster-loss-normalization literature on the relationship between climate change and rising economic losses from weather disasters.

Misinformation in the IPCC
Reviews the IPCC AR6's citation of normalized hurricane damage literature and its Synthesis Report language on tropical-cyclone detection and attribution.

Just the Facts on Global Hurricanes
Reviews global hurricane frequency and intensity data.
U.S. Extreme Weather in 2022
Reviews 2022's US extreme-weather events against the historical record.
SERIES: What the Media Won't Tell You About . . . Hurricanes
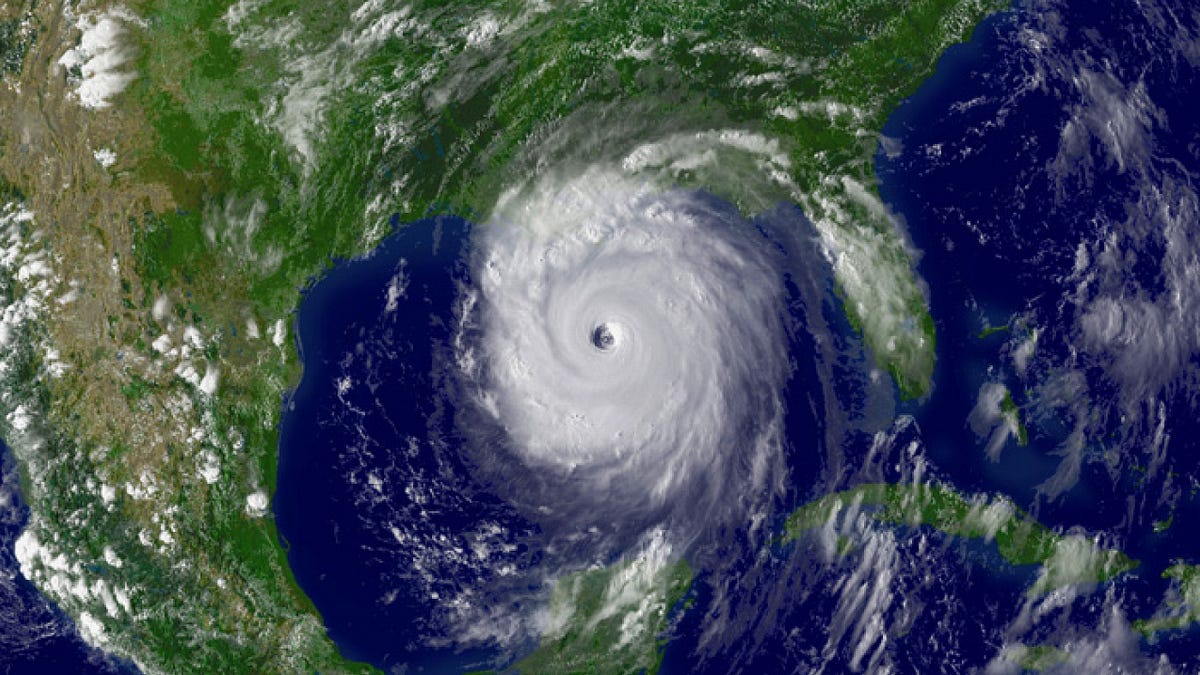
Reviews long-term US and global hurricane landfall data against contemporary media coverage.
How to Understand the New IPCC Report: Part 2, Extreme Events
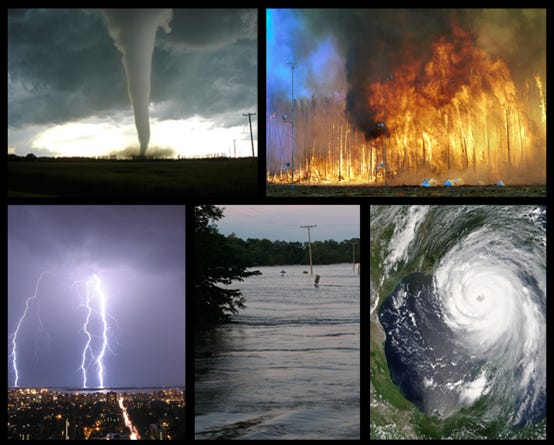
Walks through the AR6 Working Group 1 report's extreme-events chapter findings on detection and attribution.
A Remarkable Decline in Landfalling Hurricanes
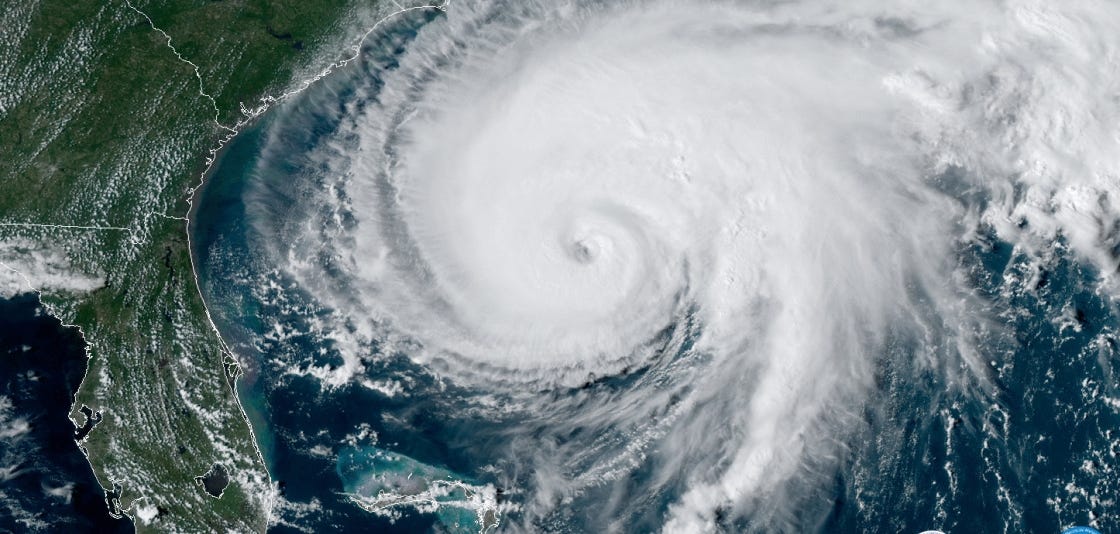
Documents multi-decadal variability in landfalling hurricane and major-hurricane counts.
Global Disasters: A Remarkable Story of Science and Policy Success
Reviews long-term global trends in disaster mortality and normalized economic losses.